What “less is more” means for junior bankers
“Less is more.” A well-known phrase with dual meaning.
It was made popular by architect Ludwig Mies van der Rohe who used it to mean fewer details and complications make something better.
But there is an earlier recorded use of the phrase by Victorian poet Robert Browning in his 1855 dramatic monolog, Andrea del Sarto. In the poem, Andrea, an accomplished painter, is lamenting to his nagging wife that even though he has mastered the technical aspects of painting, he is considered “less” to the “more” of great artists such as Michelangelo and Raphael. He’s that kid at school who received straight A's, but never took home the science fair first prize.
Both Browning's and Mies' applications of "less is more" need to be kept in mind when thinking about data visualizations.
Thousands of data points may be contained within a chart and a good data visualization needs to strike a balance between delivering a clear point and adding contextual data.
To make it a little trickier, in investment banking, chart creation is usually the domain of junior members of the team. This means the senior bankers who actually talk to clients are not likely to be familiar with the underlying data.
So junior bankers have to figure out a way to balance a rich and layered story with a single takeaway message. It isn’t easy. To create effective data visualizations, there are three objectives to keep in mind:
- Be correct: Unless you want a pitchbook thrown at your head, make sure the data quality is flawless.
- Be clear: This is where Mies comes in. The visualization needs a simple, clear takeaway.
- Be supportive: Part of the junior bankers’ role is to help senior bankers look prepared. Provide them with content that illuminates a single idea, yet arms for deeper conversations.
It’s this last point where Browning’s phrasing of “less is more” becomes important. Junior bankers need to think about how to make senior bankers the “more."
Picture this: Tomorrow at 8 a.m. a senior banker has a meeting with a prospective client and in advance of this wants a simple analysis comparing the market return performance of the client’s company with a set of comparable companies. It’s 6:30 p.m. now and the senior banker is about to leave for a client dinner, meaning he won’t have chance to review the chart or become familiar with the underlying data before the meetings. You need to make him look good. There are three ways to go about this:
1. The “At least I won’t get fired” way. Also known as a spaghetti chart.

A solid initial response and likely first impulse. When I asked senior bankers how long they could talk about this type of chart, most said a couple of minutes. That’s not that long for an hour presentation.
2. The Mies way
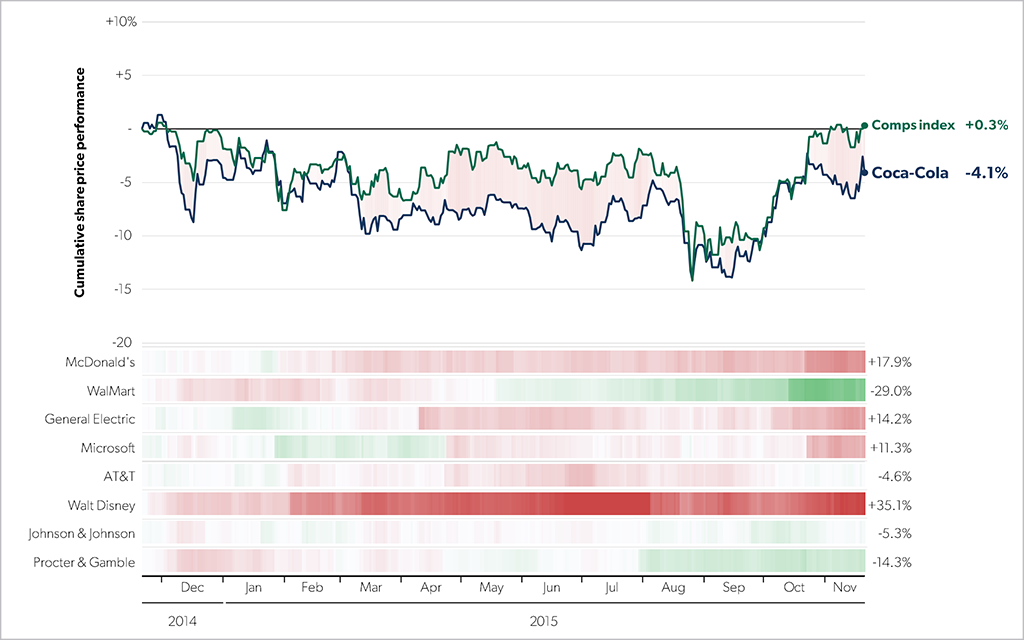
In this chart, fewer details are included, but this actually makes it easier to comprehend. All the lines representing company peers are removed and consolidated into a peer line aggregate for comparison to the subject company. Individual performance can still be discussed however, as the relative value intensity bars use different densities of red and green to show the individual comparison to the subject company.
3. The Browning Way

This small multiples chart has the same exact information as the other two charts, but will help senior bankers shine. Each company peer occupies it’s own panel in the chart, with the subject company kept for comparison. The cleaner structure means the insights are more accessible, providing greater ammunition for the senior banker’s conversation cannon.1:
This page has morphed from blah to insight. Now the senior banker can focus and bring out clear knowledge on specific comparables, adding data-driven details throughout the conversation. Additionally, I’ve found clients are more likely to add their own perspectives when more detail is shared, leading to increased engagement, a more fruitful conversation, and edging closer to winning new business.
When I shared this chart in my conversations with senior bankers, on average, they said they could talk about something like this for seven minutes or longer.
Big difference right? For junior bankers, a lot of the job is to help senior bankers win over clients by providing the fodder and details required to draw out insights. When it comes to the clarity of data, less may be more, but to breathe life into a complex data set and make senior bankers look like superstars it’s about the “more”, not the “less.”
Tell me, how do you strike a balance between less and more in client meetings? How do you strengthen your teams through your approach to data visualizations? Email me at adrian.s.crockett@gmail.com.
If you do choose to switch-up the charts, create the older version too and let the managing director select a preference. ↩