Explaining mean reversion to clients using a data visualization and a dog
Walking my Australian Cattle Dog in Prospect Park over the weekend, two things came to mind. The first was, that despite it being April, we were in the midst of another polar vortex, and the second was how Opie’s continual running back and forth between me and whatever exciting thing he was sniffing reminded me of the first time I saw a capital markets marketer successfully present mean reversion to a client (shout out to Henri Servaes).
How a dog and mean reversion relate may seem like a stretch, but bear with me as it’s far easier to remember than complicated math explanations.
As Opie's owner, I am the long-term mean. And with almost a gravitational force, Opie yo-yos back to me on a regular basis; even when he decides to charge into the lake at full speed or to see if can finally catch a squirrel, he still comes racing back for a pat on the head from his human.
So why is this a good analogy to get comfortable with? Explaining mean reversion, and subsequently a trade idea in mathematical terms can become complicated quickly1. When you approach a client with an opportunity drawing on the concept of mean reversion—that is pretty much anytime you’ve muttered, “It looks cheap”—you’re drawing on your knowledge of where the price “should” be (and by implication where it will be) in comparison to where it actually is, and explaining this can be a challenge.
I have found that a one-two punch of first walking through the analogy of a dog running back and forth and then following with a compelling data visualization quickly brings clients up to speed, and just as importantly, to your point of view.
So what kind of chart is best for explaining not only the opportunity being presented by mean reversion but also to provide timing and historical data context?
My favorite visualization of this is combining a line chart, marginal histogram, and under/over donuts into one visualization. To show what I mean, here’s a simple example related to oil prices.
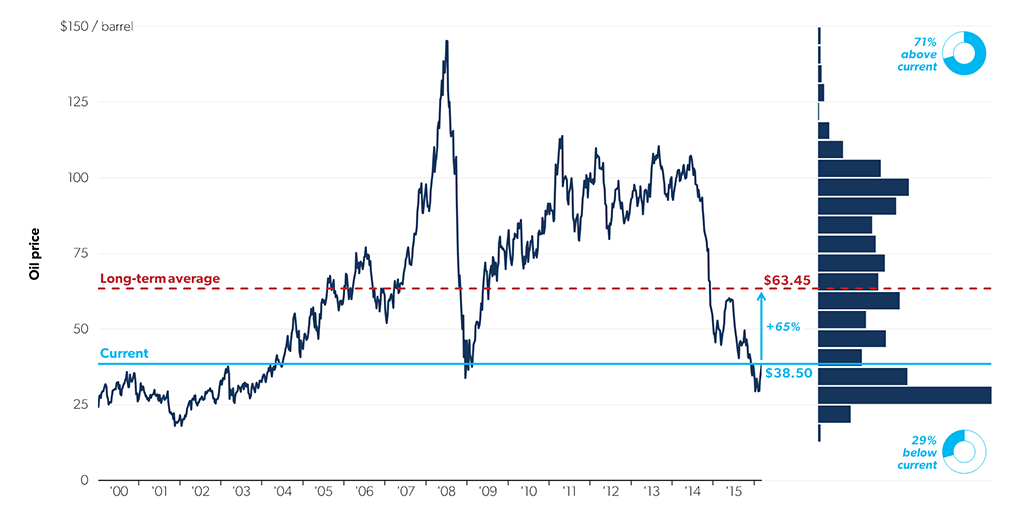
In this chart, oil is trading around $38.50, much lower than its long-term average of $63.45. But you can extract more information, such as the percentage of time that oil has been higher than current levels, and also share this insight with your client.
Teeing up trade opportunities created by mean reversion with this one-two approach can be very compelling. Clients receive a quick refresher on the concept of mean reversion and can see the supportive data indicating where prices are in the process of returning to the average, therefore sharing your view of not only if something is cheap, but where it is in the process of yo-yo-ing back to its mean price.
And while this style of marketing is most commonly used for interest rates, FX rates, and commodities, it’s application is much wider and can work for anything with a traded price. For example, if you're advising a REIT on the timing of a secondary trade, and need to show if it is cheap or expensive, this may be the chart you need.
Are there other techniques or approaches you’ve found helpful when approaching clients with new opportunities? Or methods of explaining a recommendation when asked for? Email me at adrian.s.crockett@gmail.com.
There are two risks-to-understanding here: The first is that a formal description might not be the right tool for client engagement, many people start to tune out once an equation is shown. The second more insidious risk is that they will confuse a particular parameter of the model with the concept of mean reversion. For example, we often use an Ornstein–Uhlenbeck process or its discrete-time counterpart the AR(1)process to model mean reversion ↩
`tdx_t=theta(mu-x_t)dt+sigmadW_t x_t=c+varphix_(t-1)+sigmaepsilon_t`
Here θ and φ are just begging to be interpreted as “the mean reversion” and we often say things like “the mean reversion parameter θ”. That is a valuable interpretation of those parameters but those parameters are not what mean reversion is. Mean reversion is a concept; the idea of a tendency toward the mean that can be embodied in different mathematical models. And we sell ideas, not equations when we are pitching to our clients.